 David Krause
Cost accounting charges imputed interest on the capital required for operations (chapter 4, chapter 6). An operating result after imputed interest is exactly what finance calls economic profit: profit minus the return the capital could earn elsewhere. ROIC condenses the same logic into a percentage and makes plants of different size comparable. Anyone who builds hour rates with imputed interest already thinks in ROIC — just under another name.
What ROIC measures
Return on invested capital relates operating profit after tax to the capital tied up by the operating business. The numerator is not net income but the profit the business earns regardless of how it is financed — hence before interest. The denominator is not total assets but only the capital that actually works: fixed assets and working capital, minus the funds suppliers provide free of interest.
NOPAT = EBIT × (1 − tax rate)
invested capital = property, plant & equipment + intangible assets + net working capital
net working capital = inventories + trade receivables − trade payables
Cross-check from the liabilities side: equity + interest-bearing debt − excess cash
Both routes lead to the same denominator if the delimitation is clean. In practice, data providers differ exactly here: whether goodwill from acquisitions is included, how lease liabilities are treated and how much cash counts as operating. Comparing ROIC figures therefore always means comparing definitions — the same discipline as the reconciliation in chapter 4: first decide what is operating, then calculate.
Only against the cost of capital does the number mean something
A ROIC of 10 % is neither good nor bad on its own. It becomes meaningful only against the cost of capital — the weighted average of the returns equity and debt holders expect (WACC). Above it, the business creates value; below it, it destroys value, even if the income statement shows a profit.
In cost-accounting language: operating result − imputed interest on operating capital
The two views are not identical but closely related. Cost accounting values assets at half their replacement value and calculates before tax; ROIC uses book values after tax. The question is the same — only the yardstick differs. As a rough guide, values above 10 % are considered solid and sustained values above 15 % point to a competitive advantage. These are rules of thumb, not laws: a capital-intensive supplier and a software house cannot be measured against the same threshold.
Worked bridge: which levers in the plant move ROIC
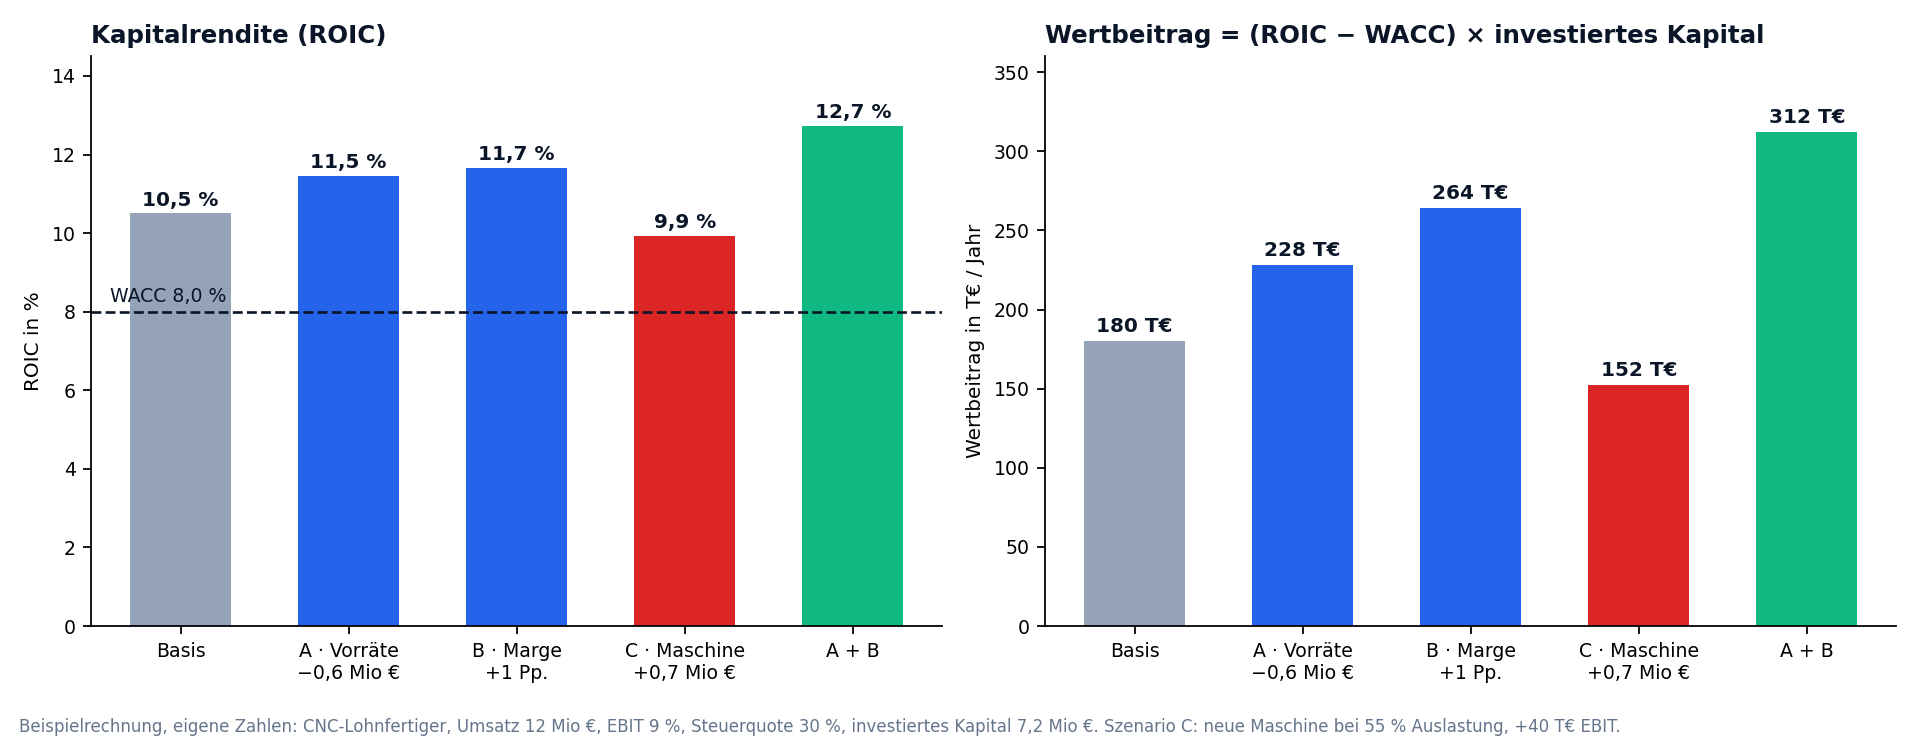
A CNC contract manufacturer with €12m revenue, a 9 % EBIT margin and a 30 % tax rate earns €756k NOPAT. Tied up are €5.2m in fixed assets and €2.0m in net working capital, €7.2m in total. That gives a ROIC of 10.5 %. With a cost of capital of 8 %, €180k of economic profit remain each year.
| Scenario | NOPAT | invested capital | ROIC | economic profit |
|---|---|---|---|---|
| Base case | €756k | €7.2m | 10.5 % | €180k |
| A · cut inventories by €0.6m (lot sizes, lead time) | €756k | €6.6m | 11.5 % | €228k |
| B · raise the margin by one percentage point | €840k | €7.2m | 11.7 % | €264k |
| C · €0.7m machine at 55 % load, +€40k EBIT | €784k | €7.9m | 9.9 % | €152k |
| A + B | €840k | €6.6m | 12.7 % | €312k |
Scenario C is the most instructive: profit rises, economic profit falls by €28k. The new machine earns €28k after tax but costs €56k in capital charge. The income statement shows a gain; the plant is worth less afterwards. The same arithmetic sits in the machine hour rate: at 55 % load, depreciation and imputed interest spread over too few hours (chapter 7) and the rate cannot be charged in the market. Scenario A, by contrast, is the underrated lever: shorter lead times appear in no profit statement, yet lift ROIC almost as much as a full point of margin.
The ROIC calculator takes your own figures — return on capital, economic profit, self-funded growth and the effect of a planned investment including the minimum EBIT. Pre-filled with this example.
The investor's view: ROIC drives growth
For investors, ROIC is more than a quality metric, because together with the reinvestment rate it determines how fast a company can grow on its own. Reinvesting half of operating profit at 10.5 % yields a good 5 % growth a year — without new capital.
Example: 50 % reinvestment × 10.5 % ROIC = 5.25 % growth p.a.
This leads to the real yardstick: growth creates value only if the ROIC of the new projects exceeds the cost of capital. A company growing at 6 % ROIC while its capital costs 8 % gets bigger and less valuable every year — scenario C at group level.
Where the metric reaches its limits
- Acquisitions distort the denominator. Including goodwill, a company looks weaker after deals without being weaker. Look at both: with goodwill for management's track record, without it for the quality of the core business.
- Cyclical businesses need averages. A machine builder in boom and slump is the same company. ROIC over five to ten years is meaningful, a single year is not.
- The logic does not fit banks and insurers. There, capital is raw material, not a means of production; the relevant metrics are return on equity and the combined ratio.
- Intangible investment is missing from the denominator. R&D and software development usually run through the income statement as expenses. The ROIC of knowledge-intensive companies therefore looks higher than it is — more in the article on intangible assets.
First: does the plant know its invested capital — fixed assets at book value plus net working capital — and how it develops over the year? Second: is the imputed interest rate in cost accounting in a traceable relation to the actual cost of capital (yield curve and imputed interest rate)? Third: is every investment calculated against the cost of capital before the decision — with realistic utilisation instead of nameplate capacity? Whoever can answer these three questions steers by economic profit, not just by profit.
Foundations: T. Koller, M. Goedhart, D. Wessels: Valuation — Measuring and Managing the Value of Companies (McKinsey & Company), chapters on ROIC and economic profit; A. Damodaran, Return on Capital, Return on Invested Capital and Return on Equity: Measurement and Implications (NYU Stern). Illustrative figures, not taken from the book's reference company.