 David Krause
In Chapter 4 and Chapter 6, cost accounting charges imputed interest: replacement value × interest rate × 0.5. The rate in that formula is the only parameter of the machine hour rate that does not come from the operation but from outside — from the capital market. It is meant to reflect what the capital tied up in fixed assets could earn elsewhere (opportunity cost). The yield curve is the most compact information on where that comparison rate currently stands. An interest rate frozen at 5 % for eight years while the market environment turned twice is the same error as a frozen hour rate from Chapter 1.
What a yield curve is
A yield curve plots the returns of bonds of different maturities — from the 1-month money-market paper to the 30-year bond. The most important example is the curve of US Treasuries, which serves as a benchmark for the entire financial markets; for the euro area, German government bonds play the same role. The curve shows how actual and expected changes in the policy rate feed through the whole interest structure. Its shape is the actual information — essentially four basic forms occur.
The normal yield curve
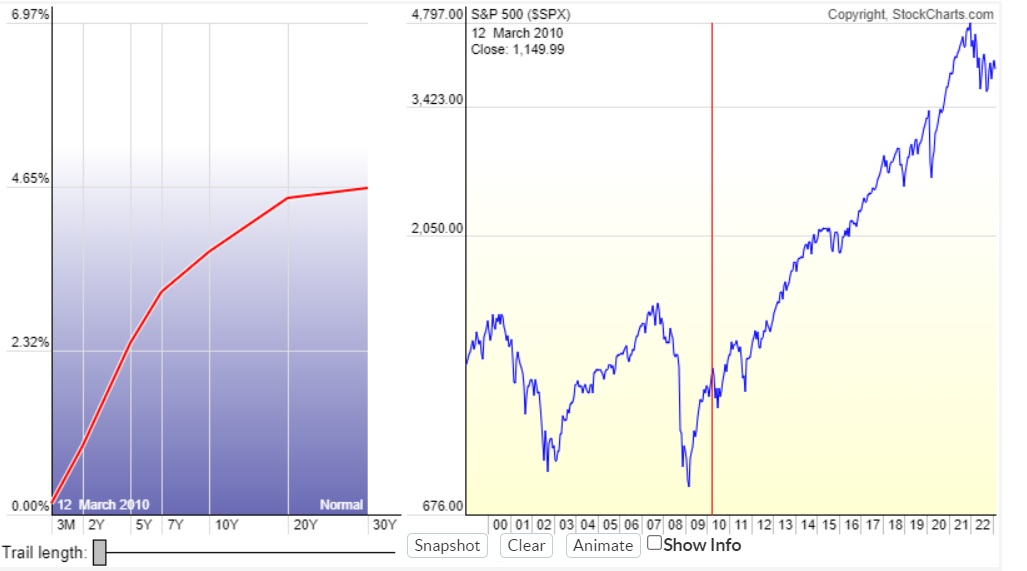
Short maturities yield less than long ones: whoever ties up money longer bears more interest and default risk and wants to be compensated. The curve rises from left to right. This form dominates when investors expect normal growth without major inflation or credit distortions.
The steep yield curve
At the start of an upswing the curve is typically especially steep. The preceding weak phase pushed short-term rates down — usually through central-bank cuts. As recovery sets in, capital demand rises, and with it inflation expectations.
The flat yield curve
Short and long maturities yield almost the same. A flat curve is usually a transition state — either on the way from normal to inverted (late cycle) or back (normalization).
The inverted yield curve
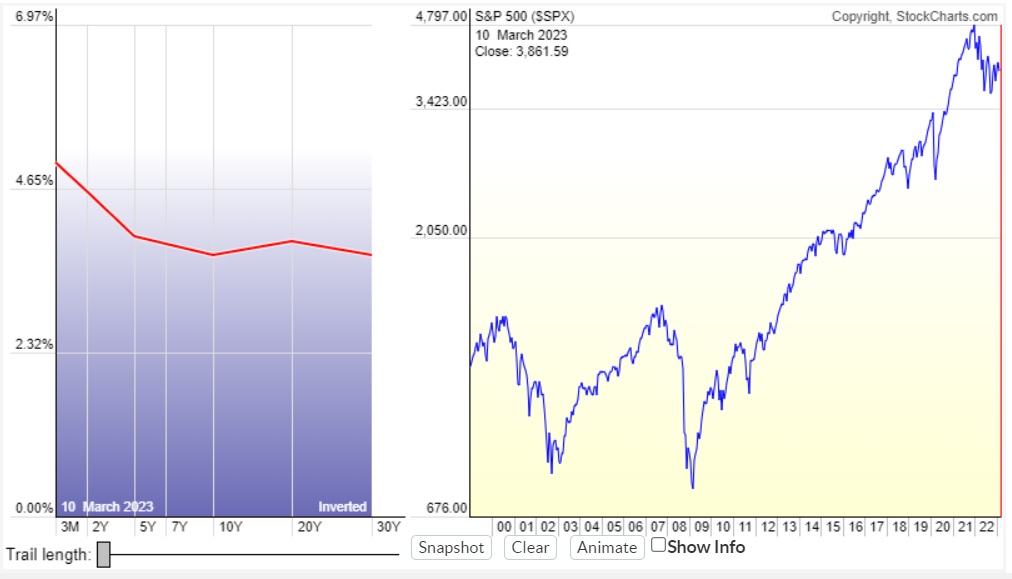
Short maturities yield more than long ones. An inversion arises when investors expect the end of the growth phase and are willing to lock in lower long-term rates before they fall further.
From market rate to imputed interest rate
For cost accounting, what matters is not the recession forecast but the rate level itself. The imputed interest rate has two components: a risk-free base rate — here the yield curve supplies the value, usually a medium to long maturity matching the capital-commitment period of the assets — and a risk premium for entrepreneurial risk. As long as the curve is flat at 4 %, a base rate of 4 % is defensible; if it stands at 1 %, a 4 % base rate is no longer tenable.
Example July 2026: base rate ~4.2 % (medium maturity) + 1.5 % risk = 5.7 % imputed rate
5-axis machining center from Chapter 7, replacement value €669,000, 3,393 productive machine hours. Imputed interest enters the hour rate as replacement value × rate × 0.5:
| Rate environment | imputed rate | imputed interest/year | share of MHR |
|---|---|---|---|
| Low rates (2021) | 2.5 % | €8,363 | €2.46/MH |
| Normalized (2026) | 5.5 % | €18,398 | €5.42/MH |
| Difference from the rate turn | +3.0 % | +€10,035 | +€2.96/MH |
Almost €3/MH of difference from the interest rate alone — at 3,393 hours a good €10,000 a year, per machine. Whoever keeps costing with the old low rate after the turn systematically underestimates their capital costs. Conversely: the effect is real but bounded — a reason to adjust the rate soberly and not re-tune it on every market move.
The 10Y−2Y spread: the classic recession signal
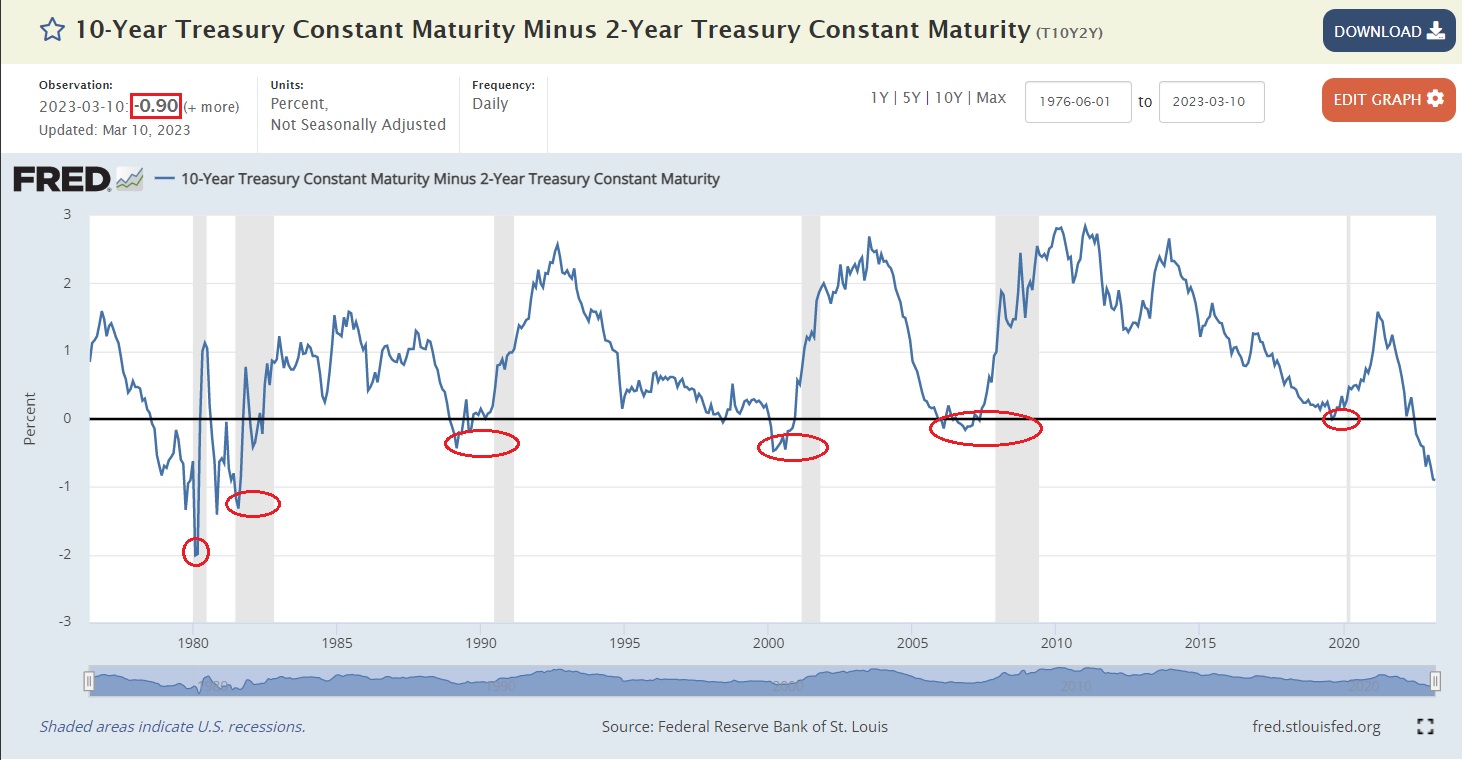
The most common condensation of the curve's shape is the spread between the 10-year and 2-year yield (FRED series T10Y2Y). If it falls below zero, the curve is inverted. Four decades of data show why this signal draws so much attention: before every US recession since 1980 the spread turned negative.
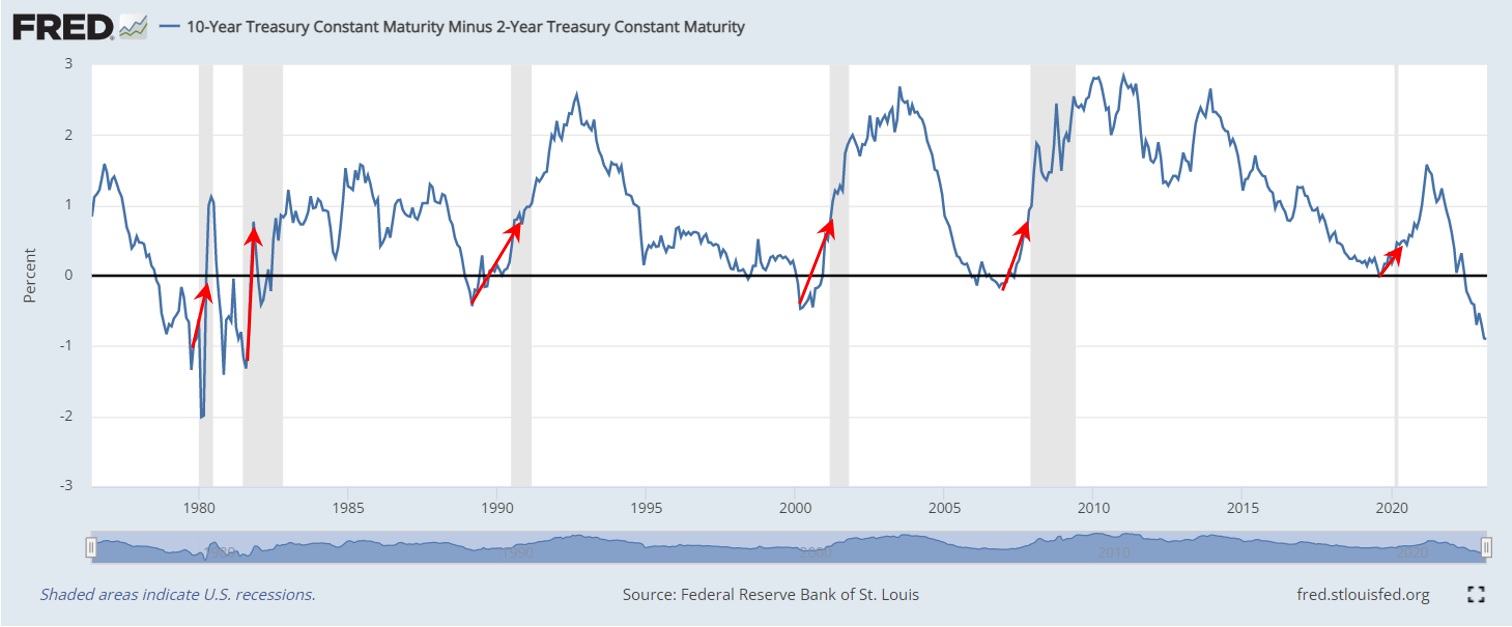
For timing, a second observation long held: not the inversion itself but its resolution — the re-steepening of the curve — historically coincided with the recession's onset. The central bank begins to cut, short rates fall faster than long ones, the curve normalizes — and just then the economy tips.
The first version of this article was written in March 2023, in the midst of the deepest inversion since 1981 (−0.90 percentage points). From the indicator's "perfect track record" it concluded a recession would surely follow. That forecast was wrong — and that is exactly why it still stands here. Documented forecast errors are the most honest calibration material there is; the same attitude runs through the forecasting-error chapters of the book.
The reality test 2022–2026: the longest inversion without a recession
What happened next is the most instructive part of the story. The 10Y−2Y spread was continuously negative from 5 July 2022 to 26 August 2024 — 537 trading days, the longest inversion phase since the 2-year note was issued in 1976. The re-steepening came as by the book too: from September 2024 the Fed cut rates, the curve normalized.
Only the recession didn't come. The US economy grew through the entire inversion phase and after the normalization. As of July 2026 the spread stands at about +0.37 percentage points (10-year: 4.55 %, 2-year: 4.18 %) — a flat but normal curve, almost two years after the inversion resolved, without the predicted contraction having occurred.
With that, the "perfect track record" is history. Strictly speaking it was already: in 1998 the spread briefly inverted without a recession following — a false signal usually left out of the popular account.
What the controller takes from this
- The rate level is the reliable information, not the recession forecast. For cost accounting, what counts is where the maturity-matched base rate stands — the curve supplies that reliably. Whether a recession follows is a second, far more uncertain question.
- An indicator is not causation. The inversion does not cause a recession; it bundles expectations. If the conditions change — fiscal stimulus, a resilient labor market, special effects — the expectation can be wrong, and the indicator with it.
- "Perfect track records" are a warning, not a buying argument. With six recessions in four decades the statistical base is thin. Whoever makes a certainty out of n=6 confuses pattern with law — the same caution that applies to any operational metric.
Two things. First, it grounds the imputed interest rate: instead of "5 %, because it always was" a maturity-matched base rate plus a documented risk premium, reviewed annually. Second, it is an early-warning signal for capacity planning — with the humility learned in 2022–2024: one signal among several (order intake, credit standards, industry indices), never a directive on its own. For the link between the interest rate and the hour rate see Chapter 6, for the treatment of imputed costs Chapter 4.
Sources: Federal Reserve Bank of St. Louis (FRED, series T10Y2Y, retrieved July 2026); U.S. Treasury; StockCharts.com. Spread data as of 17 July 2026 (+0.37 pp). The example calculation uses the book's reference company (5-axis machining center, replacement value €669,000, 3,393 MH).

Taken further from an investor's perspective: valuation, metrics and calculators on freebirdcapital.org.